ElasticSearch Query: Performance Optimisation
In one of my previous posts on elasticsearch, i shared my understanding of elasticsearch configurations and best practices. That was mostly from an indexing perspective. There are several tweaks one can use to optimise query performance as well. Improving querying time can be even more challenging than trying to improve indexing times. Lets see why querying is more of a challenge:
- Queries can go on while index is getting updated
- Different queries would need different strategies for optimisations
- There are far more configurations that impact query performance: - Query syntax/clauses used
- Index schema
- Elasticsearch configurations
- RAM, CPU, Network, IO
And there are times when you need to fire 2 or more queries in succession to get certain results back from ES. I have had one such scenario recently where i needed to fire 3 queries to ES and make sure that the response times where always less then a second. The 3 queries in question were related to each other in a sense that query 2 uses output of query 1 and query 3 uses output from query 2. For my use case, one of the queries was simple, while others two were more complex as they had aggregations, stats, filters etc.
As outlined above, there are several things that can prevent an optimal response time. Also, to safely say that a desired response time has been achieved, one needs to test and test right. A poor testing method would lead to misleading performance statistics. Below are details of my testing methodology and tweaks that led to sub second response times for 3 queries.
ElasticSearch Cluster and Indexes
- 5 Machines in the cluster
- 5 Shards per index
- 250 GB EBS volume on each machine to hold indexes
- Indexes are stored as compressed
- No indexing takes place while testing (my use case asks for indexing in batch once a day)
- 3 indexes - Index A: with 24+ million records (used in 1st query) - All integer fields.
- 4 fields.
- Index B: with 90+ million records (used in 2nd query) - All integers
- 3 fields
- Index C: with 340K records (used in 3rd query) - String, Integer and Date fields
- only few fields used in querying.
- Different machine types: - to hold ES indexes: m3.large to c3.4xlarge
- RAM - Different sizes for tests, starting from 4GB to 15GB given to ES instance.
Client Machines
- m1.small ec2 instances.
- At least 3 client machines (later changes to 6, 10 and 20)
- 10 concurrent threads on each client (later changes to 5, 3)
- use python based ES client to query the cluster
Testing Methodology
- clear ES cache before a test.
- use unique ids to fire 3 queries for each id. Use 1000, 5000 and 25000 unique ids to measure performance.
- 30 concurrent user (id) requests gets translated into up to 100+ concurrent ES query requests, as each user request fires 3 ES queries.
- look at 90th percentile time for query performance
- First 100 results are discarded (ES cache warming)
- Performance is measured in terms of “took” time in ES and actual time (with network latency) spent inside python script. First 5 charts in the post below* plot time with network latency*. We look at the “took” time only after reaching certain point in terms of performance.
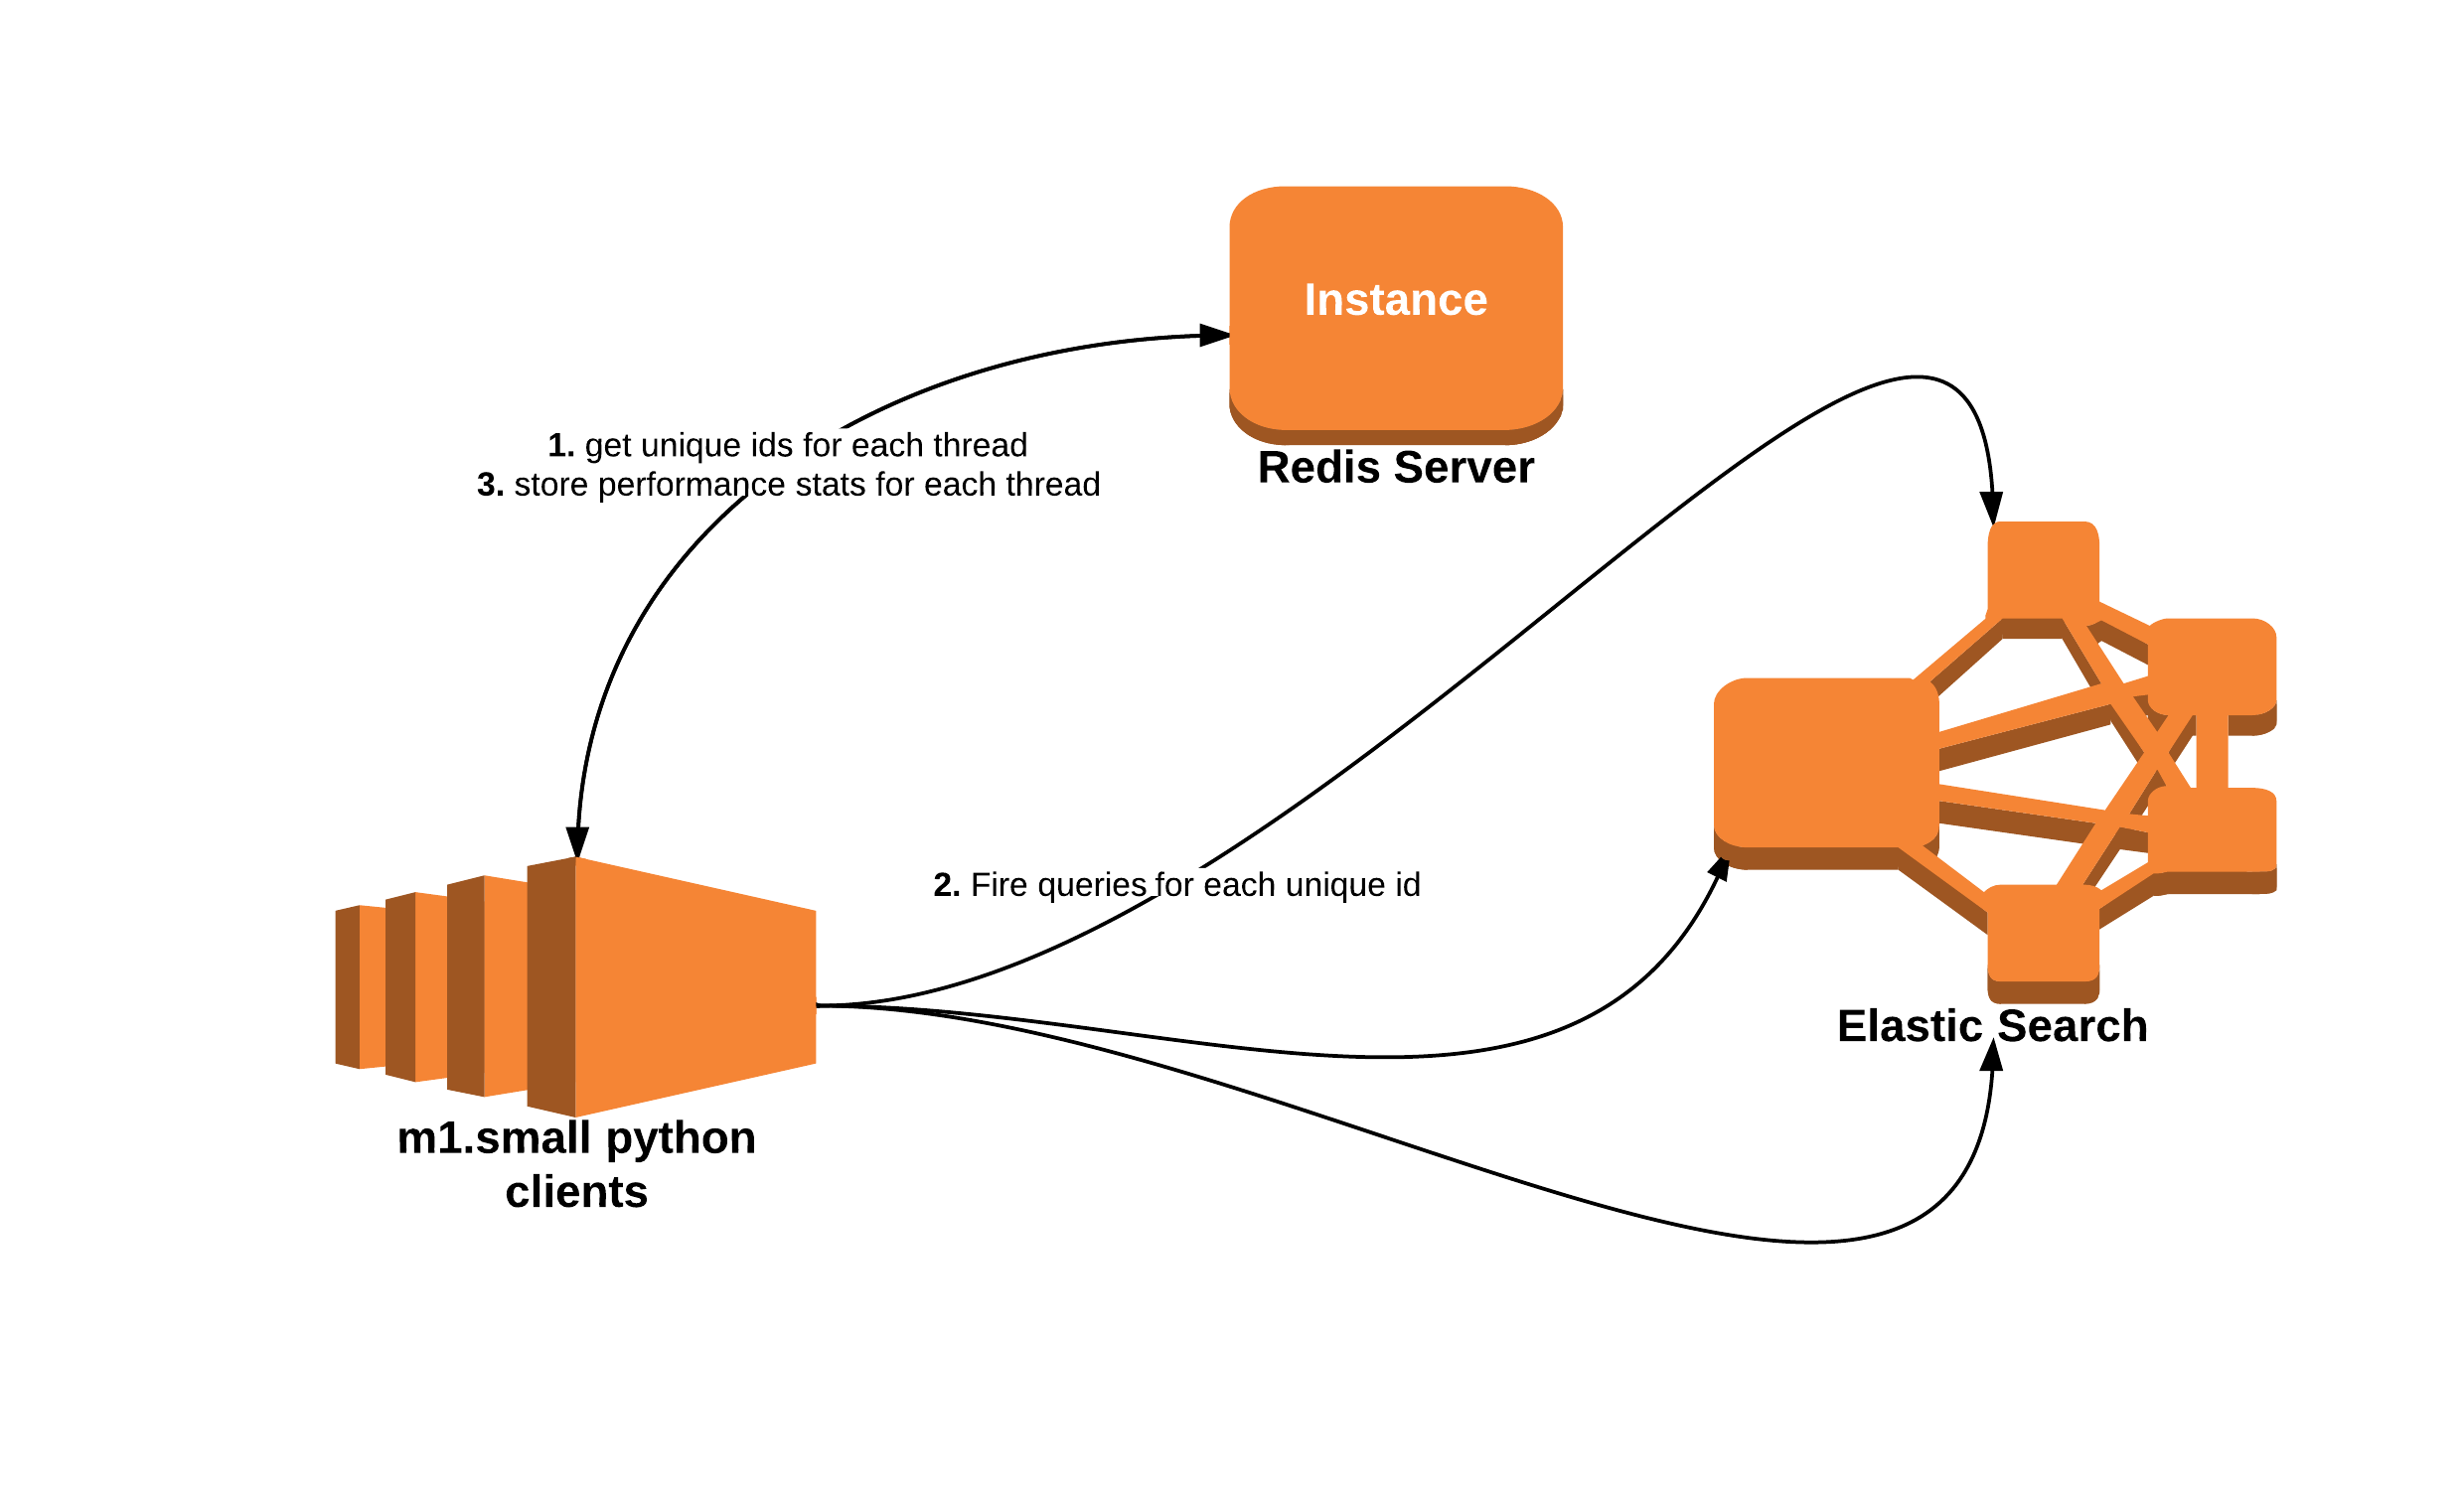
This is how a network diagram would look:
Queries
First
This is a query on Index A with 24+ million records.
res = es.search( index=\"index1\", body={\"query\":{\"bool\":{\"must\":[{\"term\":{\"cid\":value}}]}}}, sort=[ \"source:desc\", \"cdate:desc\" ], size=100, fields=[\"wiid\"], _source=\"true\")
I parse results of these queries to get certain fields out and pass on to the 2nd query. Lets call those fields as:q1.field1 and q1.field2
Second
This is a query on Index B with 90+ million records.
res1 = es.search(index=\"index2\", body={\"query\":{\"filtered\":{\"filter\":{\"bool\":{\"must\":{\"terms\":{\"col_a\":q1.field1}},\"must_not\":{\"terms\":{\"col_b\":q1.field1}}}}}},\"aggs\":{\"i2B\":{\"terms\":{\"field\":\"col_b\", \"size\": 1000 ,\"shard_size\":10000, \"order\" : { \"mss.sum\":\"desc\"} },\"aggs\":{\"mss\":{\"stats\":{\"script\":\"ca = _source.col_a; index=wiids.indexOf(ca); sval=0; if(index!=-1) sval=svalues.get(index); else sval=-1; return _source.col_x*sval; \",\"params\":{\"wiids\":q1.field1,\"svalues\":q1.field2}}},\"simSum\":{\"stats\":{\"script\":\"return _source.col_x \"}}}}}}, size=1)
This query uses features like aggregations and scripts for calculations. Again, i parse results and get a field out. Lets call that field as: q2.field1
Third
This is a query on Index C with 340K records.
res2 = es.search(index=\"index3\", body= { \"query\" : { \"filtered\" : { \"query\":{ \"terms\":{ \"wiid\":q2.field1 } }, \"filter\" : { \"bool\" : { \"must\" : [ { \"range\" : {\"isInRange\": { \"gte\" : 10 } } } , { \"term\" : { \"isCondA\" : \"false\" } } , { \"term\" : { \"isCondB\" : \"false\"} }, { \"term\" : { \"isCondC\" : \"false\" } } ] } } } } } , size=1000)
Now lets look at some of the tweaks and results on this setup.
Let's get Real
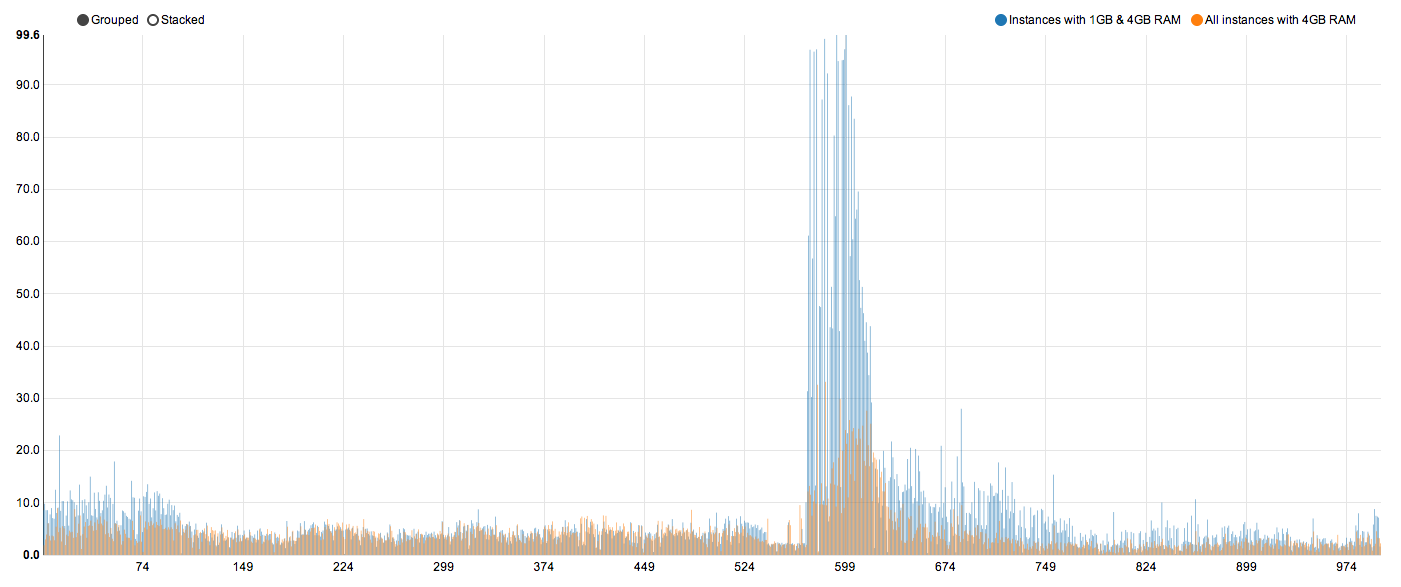
1. 1000 unique users, m3.large, 4GB RAM
I tried measuring performance on m3.large ES instances. The results were poor.
a. 2 instances with 4 GB of RAM and others with default 1 GB of RAM.
90th percentile time was around 12 seconds but rest of the responses had huge timings. Some of them took as much as 100+ seconds.
b. all instances with 4 GB RAM.
90th percentile comes down to 6 seconds and rest of the calls show a top of 30+ seconds. Which is still a huge improvement over 100+. Enough RAM on all boxes has a significant impact on performance.
2. 1000 unique users, m3.xlarge, 7GB RAM
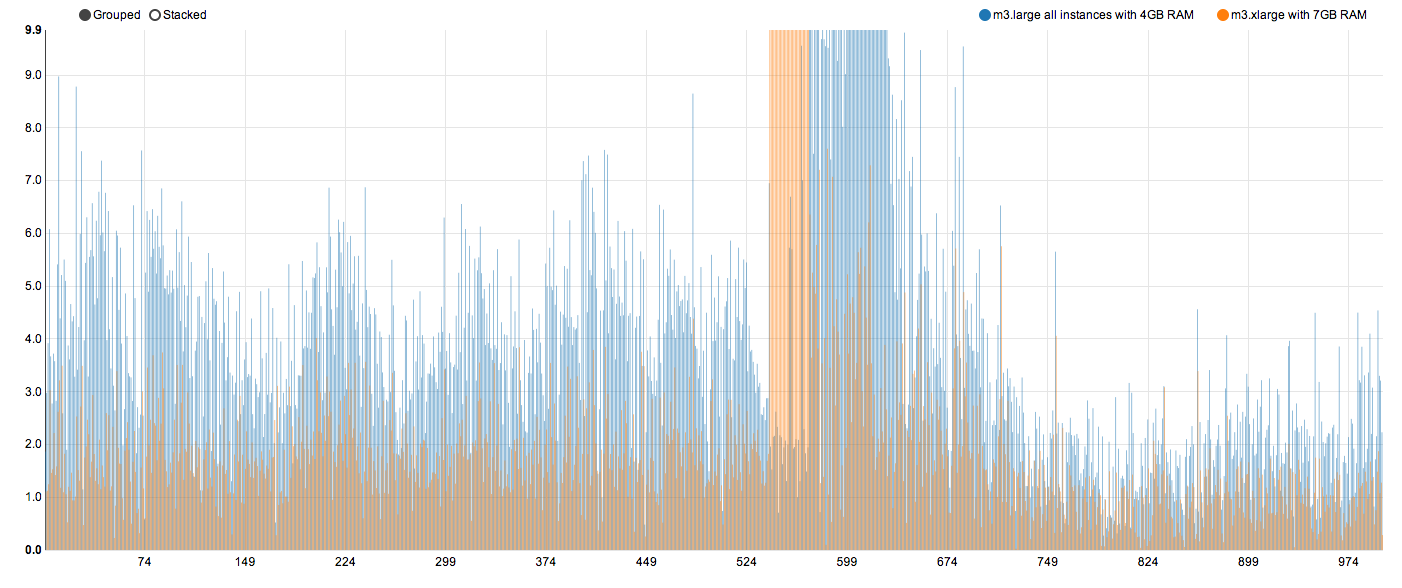
c. all instances on m3.xlarge and with 7GB of RAM
90th percentile now reduces to around 3.5 seconds. The max comes down to 21+ seconds. Again, more RAM translates into significant performance improvement without any other optimisation at the level.
3. Playing with index segment sizes
Quick wins till now, increase RAM and improve performance. Still not even close to sub second. While indexing data into ES, several segments get created. If an index is constantly getting updated, ES would keep on merging segments together. A segment is one lucene index file. The less segments we have, faster queries become; to a point. *Index B *had 13 segments. Second Query above is fired against Index B. I reduced the segment size manually (would go for a merge policy in production) from 13 to 7. And this is how the performance looks compared to the last test.
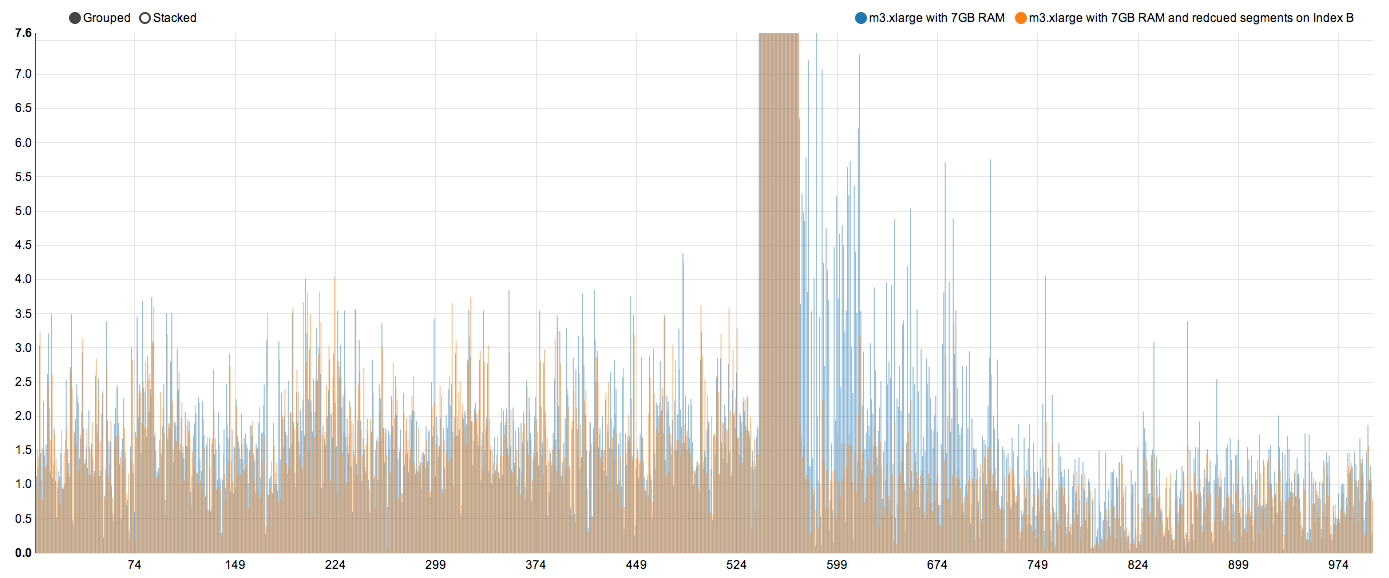
d. still m3.xlarge with 7GB RAM but with reduced segments on Index B
90th percentile comes down to 2.6 seconds now. As we can see, all of the response times do not improve. But there is a huge chunk after 599 which improves. And that brings overall times down. Reducing index segments (ideally with merge policy) has an impact on query performance.
Trying to reduce segment size further, did not yield any performance gains. I decided to move on the next higher EC2 instance.
4. 5000 unique users, m3.2xlarge, 15 GB of RAM
Moving to the next higher box, did yield performance improvement for 1000 unique users. 90th percentile response times started touching close to 1.5 seconds. Also, increasing load to 5000 unique users did not impact performance adversely, i got the same 90th percentile time. I guess this is due to increased capacity in terms of RAM and CPU and also may be a better network.

e. m3.2xlarge with 15GB RAM
90th percentile for even higher unique requests comes down to 1.5 seconds.
One common observation i had during my tests on these large instance was that the RAM was never under stress. Out of 15GB allotted to ES, ES would utilise only 6 GB. On the other hand CPU would always max out, touching 100% frequently during the time of tests. Since RAM was not fully utilised, i played with *indices.cache.filter.size, *which is set to 20% of total ES heap by default. In newer versions of ES this default has been changed to just 10%. I changed this value to 30% and to even 40%. Increasing this value improved RAM utilisation but did not strangely yield any significant performance benefits.
Since CPUs on all ES instances kept touching 100%, i decided to look at query and syntax related optimisations.
5. Query related changes, still on m3.2xlarge with 15GB RAM
Since my queries use aggregations and scripts, i thought they were time consuming. After a bit of searching on ES forum and ES website, i decided to replace source inside my script in 2nd query with doc['fieldname'].value. This single change made CPUs to relax. CPU times cooled down to at 20-30%. And query performance improved too. Using _source in script causes values to be read and parsed from disk. doc values on the hand get values from fields in RAM. And that improves performance dramatically. I changed all my queries to be filtered queries as well. A filtered query does not calculate a score for each document, thus saving time. In this use case, i do not care about ES scoring at any point. So this is useful only if your use case permits it. I played with count search type too. Count type did not help much.
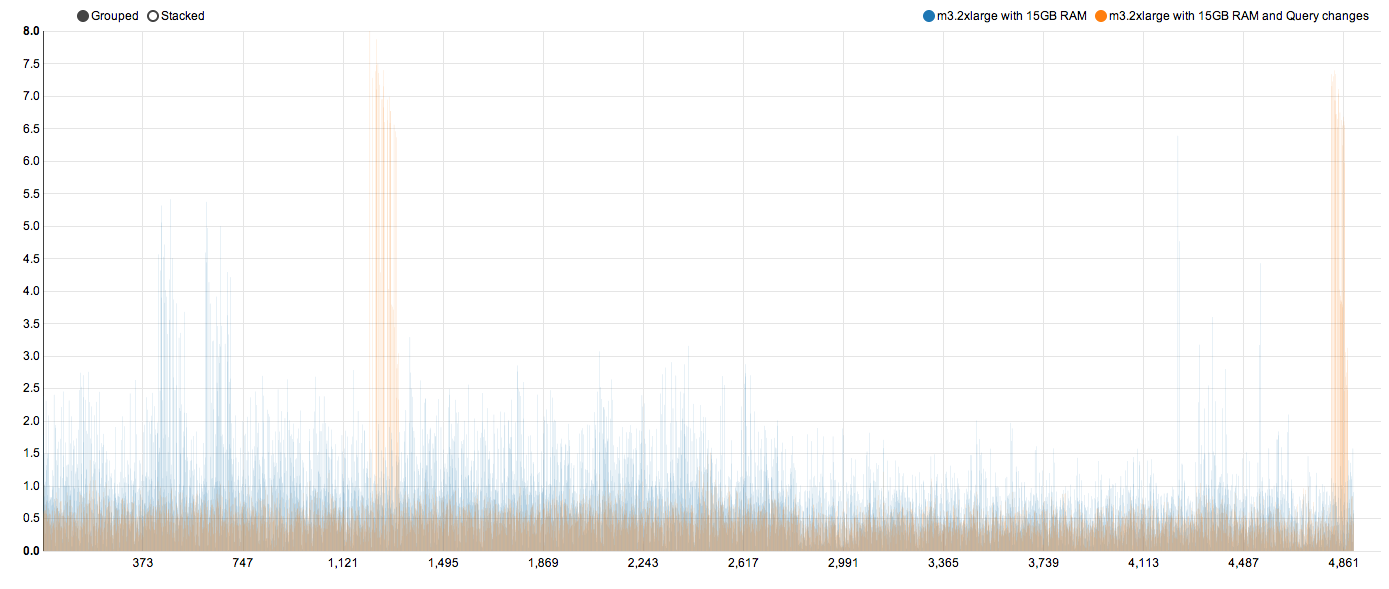
f. m3.2xlarge with 15 GB RAM and query changes
90th percentile is now at just 737 ms. Well under one second!
Closely looking at the chart above, we see two sets of orange bars going higher than the previous blue bars. Something strange has happened. While most of the response times have improved by more than 100%, two sets of response have become worse. This is where we start looking at time taken by ES (“took” time in ES) vs the time we see in scripts after network latency. Plotting a chart between these two gives a better picture.

This chart shows a huge difference in times between what it takes on ES and when it comes to the script. The 90th percentile for ES “took” time is just 200 ms *while the *time with latency is 737 ms.This suggests that somewhere network is slow, that somewhere could be ES cluster or the link between ES cluster and client machines. I rules a slow network on ES cluster out as timings there for 3 queries is just 200 ms. So its something to do with client machines which we shall discuss in this post after couple of more tests.
Also, this does not explain two large bars, for which ES took time is on the higher side. May be this is due to many requests on ES cluster at the same time and CPU is proving to be not adequate. I decided to move to the next higher EC2 instance, c3.4xlarge.
6. 5000 unique users, c3.4xlarge with 15 GB RAM
Let's first check what we have been checking all this while. Time with latency on these instances against previous instance type.
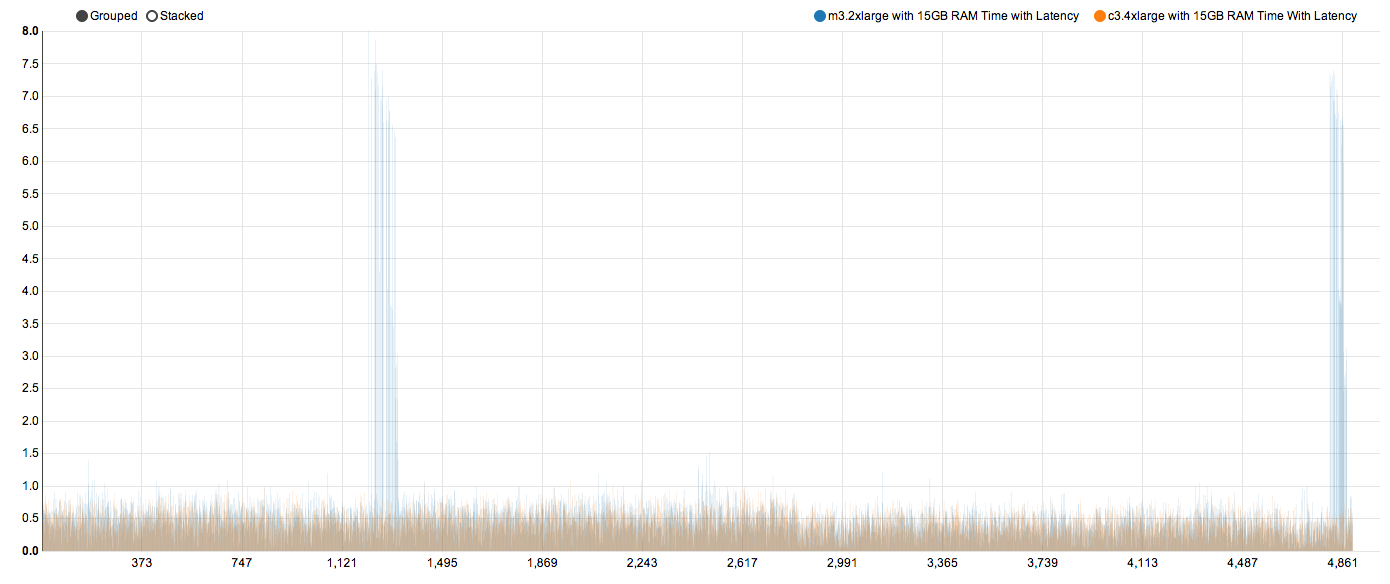
The most significant change is the disappearance of two towers from previous test. We now have uniform response times. This proves that those two spikes in the last test was due to CPUs not keeping up with load.
g. c3.4xlarge with 15GB RAM
The 90th percentile now stands at 671 ms. Which is still a good improvement over 737 ms.
Let's look at the ES took time. A ES took of 200 ms in last test is not worrisome but lets look at it anyway.

Again, both the towers have disappeared. In fact, the 90th percentile ES took time is now just 126 ms! High end instances with extra CPUs have delivered. We can safely say that we are good for sub-second response time for 3 combined queries. The only concern is high network latency. Which brings our focus back to the client machines. We have tweaked everything to gauge performance impact other than the client machine. Is high network latency manifestation of poor client machines? We fork 10 threads on each client machine. Can that be a problem?
7. 5000 unique users, c3.4xlarge with 15Gb RAM and 6 client machines
Let's keep ES cluster configuration same as before. But let's double client machines from 3 to 6 and reduce number of threads on each machine from 10 to 5. In theory, we have kept concurrent requests to the same level as last test. In reality, concurrent requests increase.

It's clear that the latency has come down for almost all requests. The 90th percentile now stands at 428 ms which is a huge improvement over 671 ms. The took time goes up to 160 ms compared to 126 ms in the last test. But that is not of concern. This test provides evidence that high latency was due to poor client machines as well.
If poor client machines are adding to latency, could less stressed client machine further reduce latency? Let's test that.
8. 5000 unique users, c3.4xlarge with 15Gb RAM and 10 client machines
Let's keep ES cluster as is. We change number of client machines from 6 to 10 and reduce number of threads on each machines from 5 to 3.

Latency improves. 90th percentile becomes 350 ms compared to 428 ms. Again proving that less stressed clients are contributing to improved timings. Time on ES cluster now becomes 208 ms. An increase which is understandable because less stressed clients are firing more and more concurrent requests, putting ES to do lots of work. Important thing is the time difference between ES took time and script time is around 150 ms only. All the times are now under 500 ms. This is a very comfortable position to be in for a SLA of sub second.
But will the performance hold, if we increased the load 5 times more? What if we get 25000 unique users to serve? How does the numbers look under sustained load for longer period of time?
9. 25000 unique users, c3.4xlarge with 15Gb RAM and 10 client machines
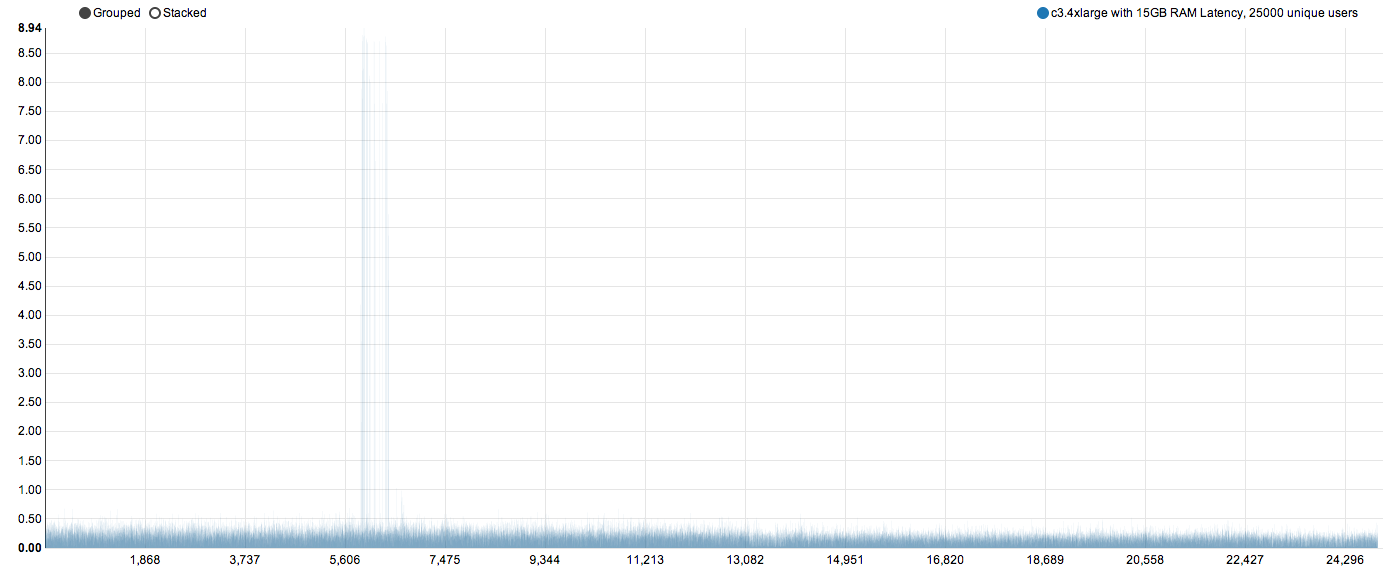
Even for 25000 unique users, we see a 90th percentile time of 335 ms and ES took time remain around 200 ms. We see 10 or so request going 8+ seconds. This is a sign that we did nuke the ES cluster for a while. Big desk showed 600-700 queries per second on ES cluster.
Bottomline
While tuning performance, how we test becomes equally important. Tuning ES towards a certain goal is achievable but it needs careful tweaking of several parts of the system. Here we managed to get sub 500 ms response times. For some other use case and data set, these same tweaks would not work. If the record size is large with many many fields in it, having SSDs would help. In this case we never needed to go for SSDs.
Hope this is useful to everyone working with ES.