OpenTSDB/HBase - Improving Stability And Performance
OpenTSDB is a time series database based on HBase. It is used as a distributed monitoring system where metrics are collected and pinged to openTSDB from servers/machines. The metrics collected can be anything from CPU, RAM usage to Application Cache Hit ratios to Message Queue statistics. It can scale to millions of writes per second as per its homepage and in theory it can.
Anyone who has used Hbase substantially in the past knows that it can prove to be a nasty beast to tame. Specially due to how row keys work. A poorly designed Hbase row key can lead to all reads and/or writes going to a single node even when we have a cluster. This is called region hotspotting and it causes sub-optimal cluster utilisation with poor read/write times. We should, ideally, utilise the cluster to its full potential and in the process make sure that reads and writes from a system meet a SLA.
OpenTSDB avoids problems of hotspotting by designing its key intelligently. It is distributed, fault tolerant and highly available as well. It is used at various places in production.
It indeed works well until one starts to take it for granted.
Broken promises?
One of the projects i have been involved is started with a notion of broken promises from hadoop/hbase/opentsdb. I was told \"we love tsdb, it has been the most used tool in the org BUT it has become slow, we are missing data.\" The system in question was a 4 node Opentsdb cluster with:
- 32 GB RAM: 12 GB for HBase, 3 GB for Data Node
- 12 Cores, 2.0 GHz Intel CPU
- 8 * 1 TB SATA HDDs
- 10 GB network connections between nodes
- Around a ~ million distinct metrics getting into tsdb regularly.
- The cluster runs on default tsdb and hbase configurations.
Read response time was very erratic. At times it would be below 2 seconds or above 10 seconds or mostly 25-50 seconds. Queries to tsdb would take forever to complete. Clients would timeout waiting for results.
It was known that there was some hotspotting but no one knew why it was happening or how to fix it. Also, no one wants to play with a production cluster.
"Clearly tsdb is not keeping up with our work load". Right, Time to do some digging and see if it is really a case of broken promises. Before we start....
HBase in a minute
HBase is a nosql columnar store. It has a concept of table which contains column families. Usually there are 1 or 2 column families per table. Data in a table is stored in a sorted order based on a row-key.
Each table is divided into several regions (based on amount of data it holds). Each region contains a store per column family which is turn contains: a memstore and several store files.
Why do we have a hotspot? We use tsdb!
A general understanding with tsdb is that we will not have hotspots as keys are created intelligently. So what is happening with this cluster? We need monitoring of the cluster itself, meta-monitoring in a sense. We need to monitor the cluster that helps monitor everything else.
Guess what, in this case, tsdb is monitoring itself. So we get to all sorts of metric and graphs for our cluster.
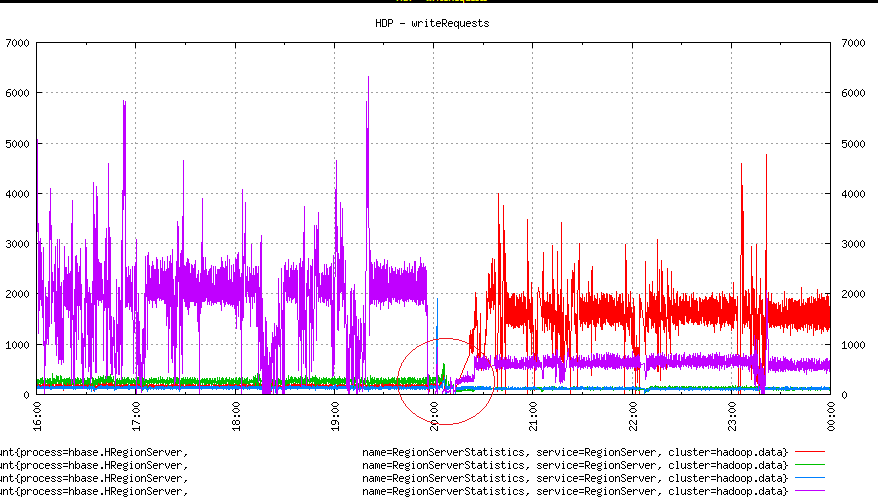
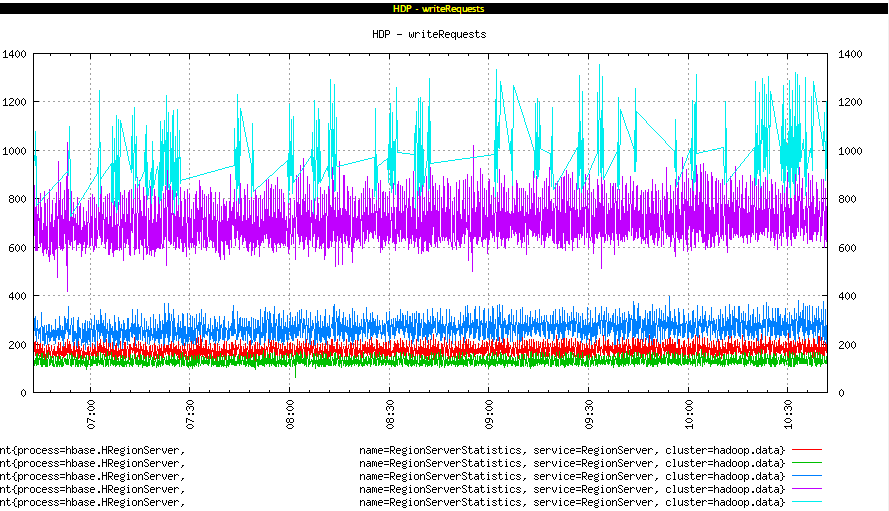
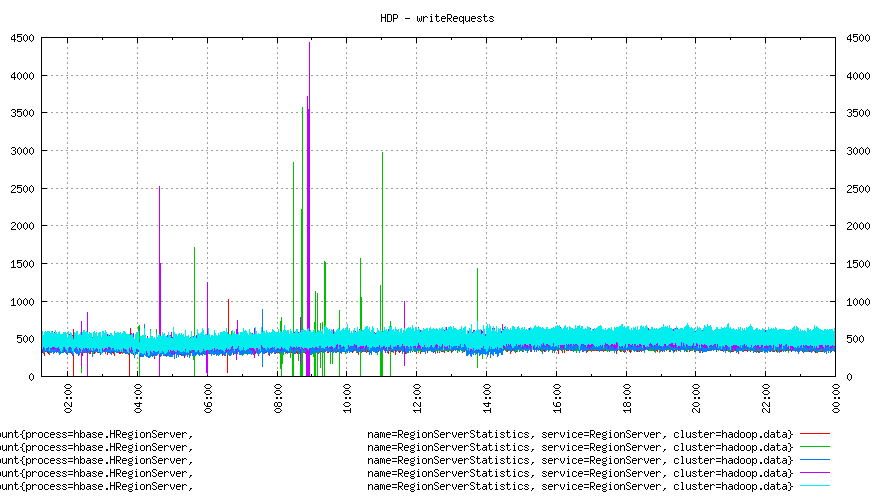
Hotspot
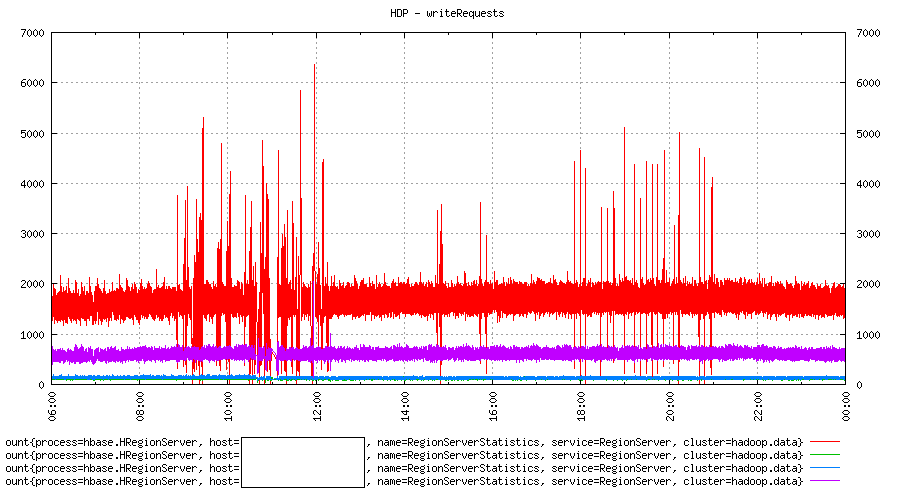
As we can see in the image above, out of 4 machines, one is getting way more write requests (1500-2000 a second) than others. Others are at least half or less. One box (green) is not even visible anywhere!
If it was a hbase cluster created by one of the in-house teams, chances were that the team got the row-key design wrong and ended up with this cluster state. This is a openTSDB hbase cluster and keys are well designed. With tsdb this can possibly happen only if:
- we started with many different keys and somehow stopped writing to all of them.
- we write to a few keys a lot more than others.
Even when we write too few keys a lot more than others; hbase by design, at some point, would split the region and move some part of the hot region to a random machine. With that we would get, in theory, writes going to at least two different machines. That is clearly not the case here.
There are many unknowns here before we can decide on as to why this happened. May be we are really writing a lot to a few keys.
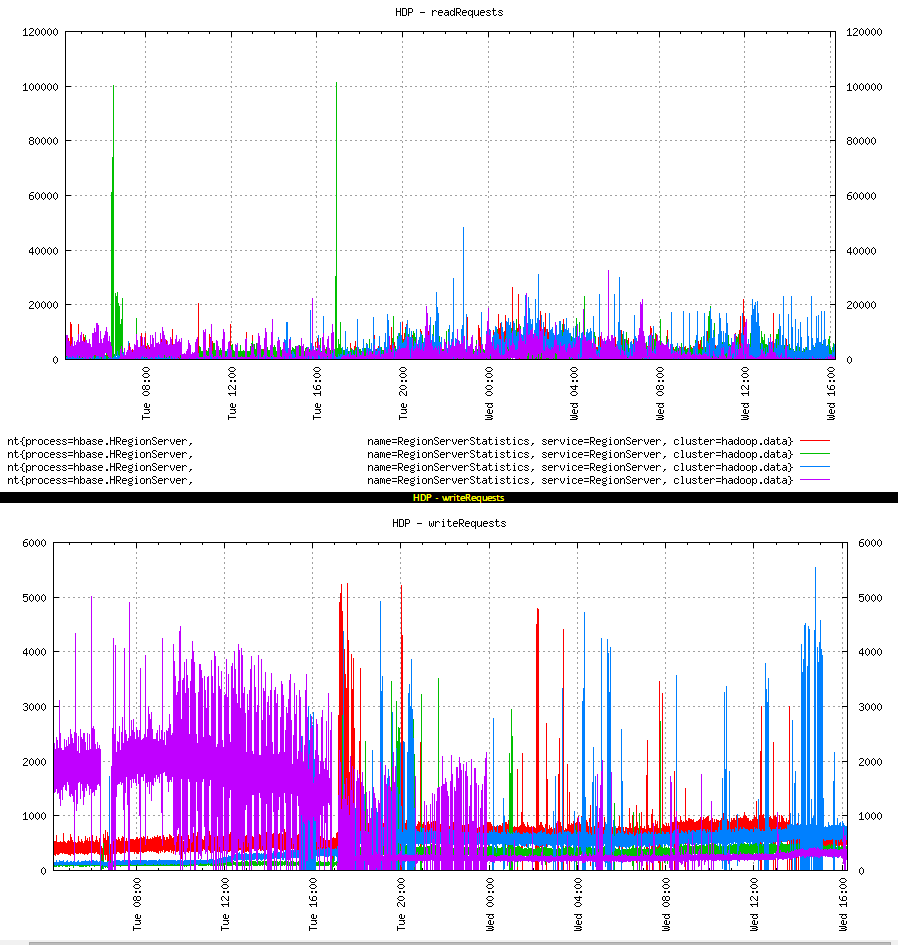
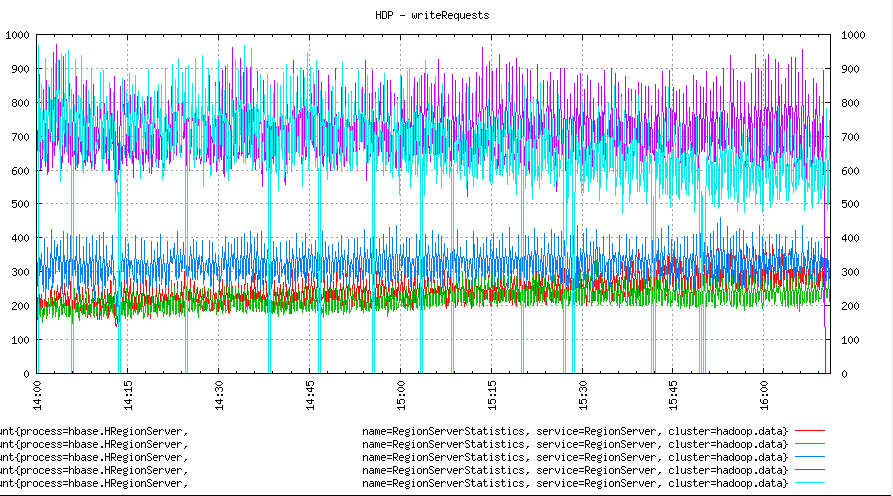
Let's have a look at the reading pattern:
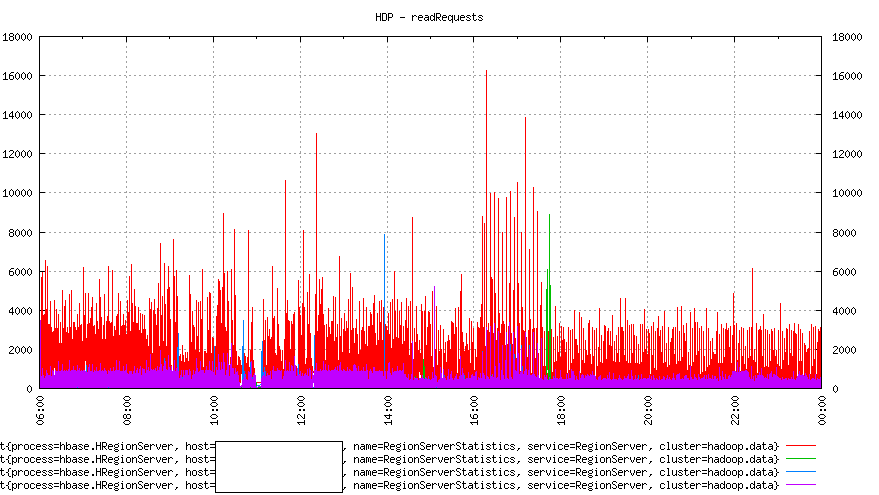
Two important things to note in the image above:
1. Reads follow write pattern. A machine with high writes gets high reads as well.
2. Reads are going to only two machines and are not well distributed.
It seems that most of the clients are reading data which was written just now. Readers are overwhelmingly interested in recent data.
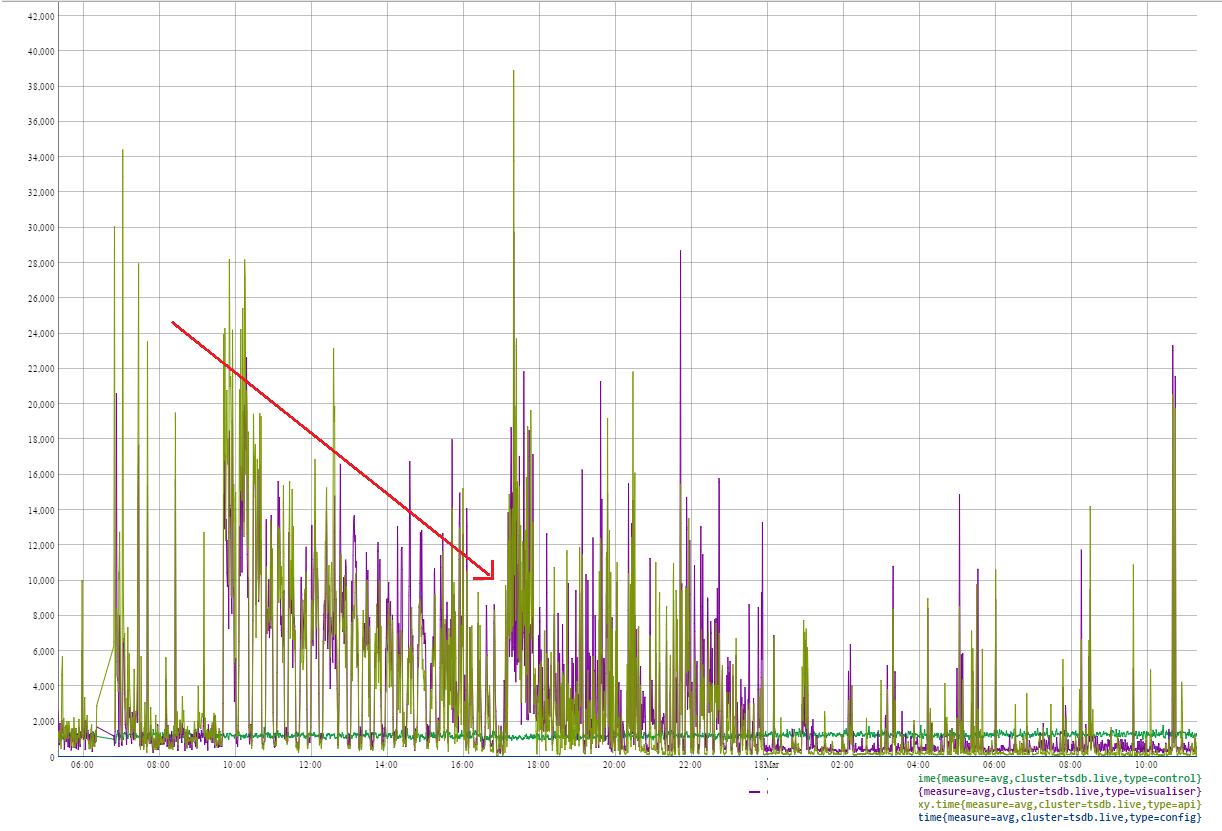
And this is how the response times to queries looked:
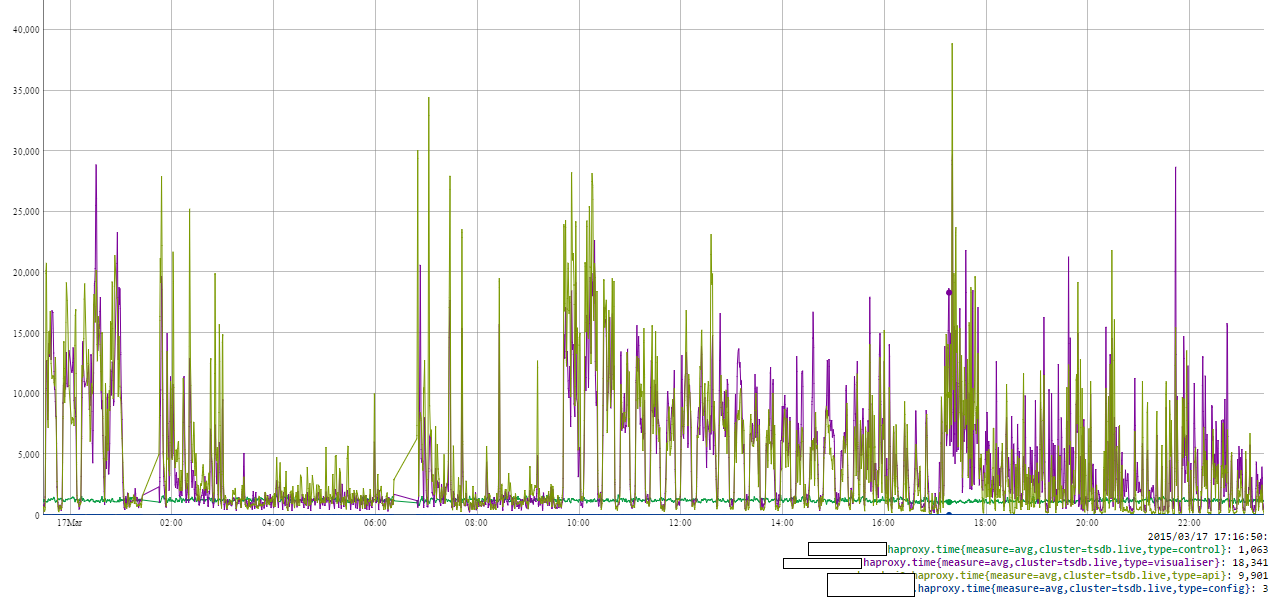
The one word that describes this graph is erratic. Response times are way beyond civilised limits of 1-2 seconds.
Based on this much info, we gather that there is a problem with response times and it looks like it is related to hotspotting.
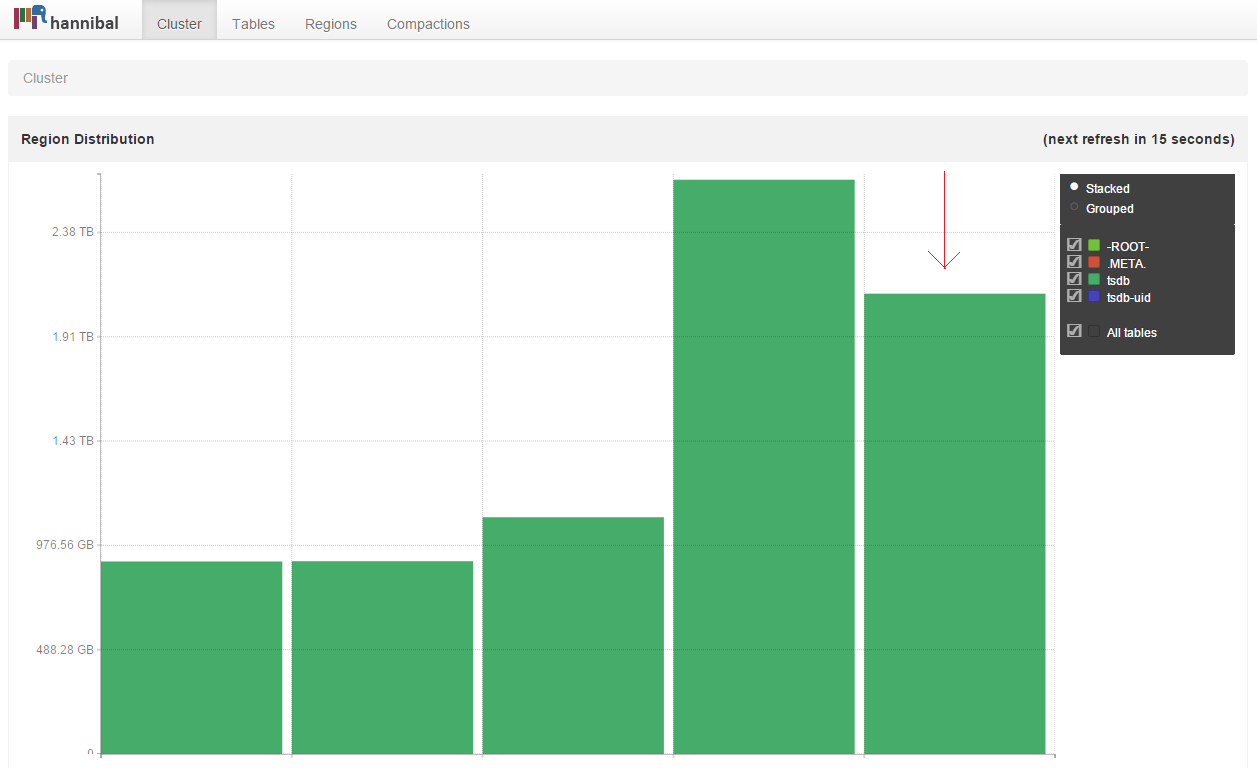
We had another tool at our disposal to look at the underlying Hbase cluster: Hannibal. Hannibal is an excellent tool to visualise the state of hbase cluster and look into region details. We can look at the region distribution across nodes.
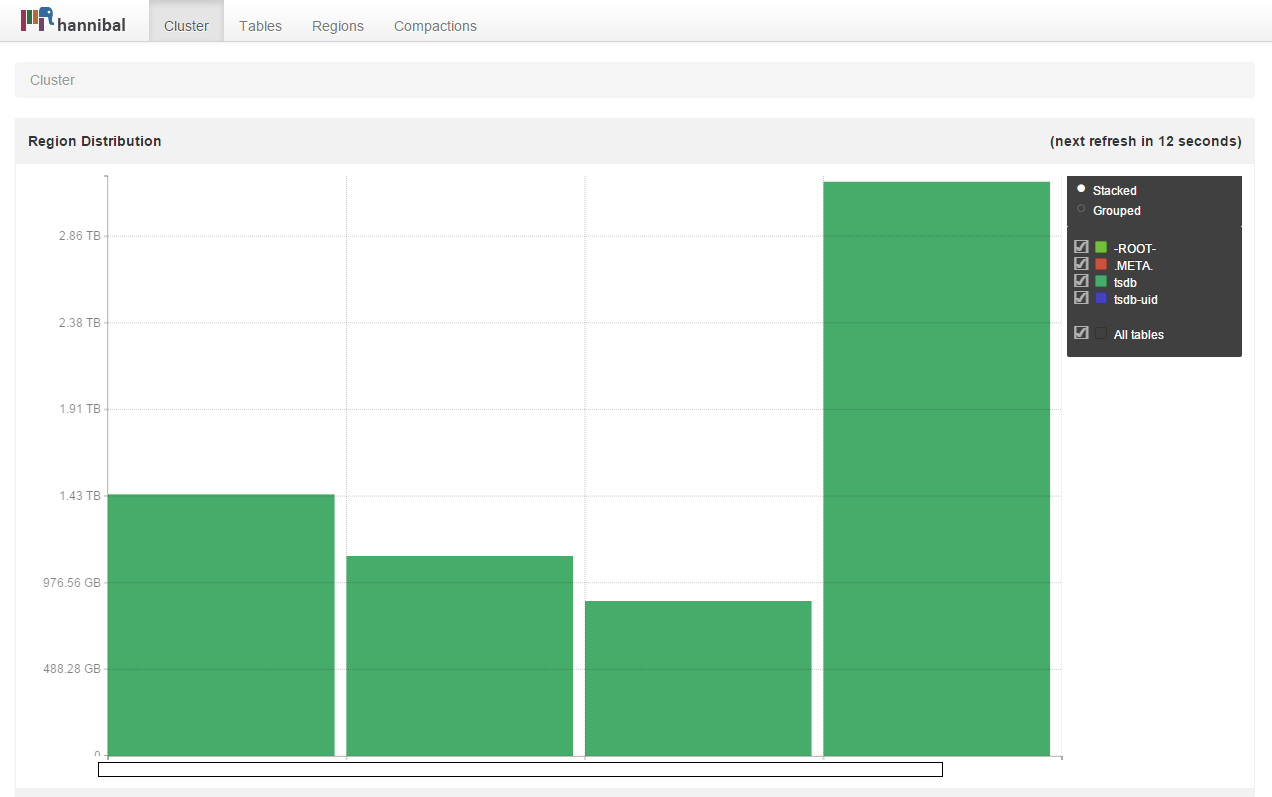
This reinforces our understanding that one of the server is a hotspot. One of the machines is holding almost twice as much data as others. This brings us to a key question: How many regions each of the nodes holding? The answer was 700+ and they are evenly distributed across all nodes. That clearly means that we are using something called hbase balancer.
Hbase balancer makes sure that the regions are evenly distributed across all nodes. It does a great job But.. in this case does not look like it. Even when the region counts are equal, the amount of data is not. And that is something the current balancer cannot do.
What is the problem exactly?
700+ regions on a node with 12GB RAM is far too many, in fact the recommended region count is 20-100. No doubt this cluster has problems. Let's see how and why.
First some default settings in HBase:
    hbase.hregion.memstore.mslab.enabled=true
    hbase.hregion.memstore.mslab.chunksize=2MB
    hbase.hregion.memstore.flush.size=128MB
    hbase.hregion.max.filesize=10GB
    hbase.regionserver.global.memstore.upperLimit=0.4
MSLAB is a memory area maintained per region internally by Hbase for avoiding full GCs. As we can see it is 2MB by default for each region. For 700 regions it is ~ 1.4 GB of heap before any data is written!
How many regions per RS?
Each region in HBase has a memstore per column family, which can grow up to hbase.hregion.memstore.flush.size. We also have a upperLimit on the total memstore size in terms of available heap. Based on this, a good starting point for number of regions per region server is:
(RS memory)*(total memstore fraction)/((memstore size)*(# column families))
For our clusters, this works out to be:
12000*0.4/128*1
i.e. ~ 38. This is assuming that all the regions are filled up at the same rate, Which is not the case (we will see below why). We can go with as many as 3-4 times this number which would be ~ 160. So, for our cluster we can have 160 odd regions safely on each region server. We have 700 on each. How do we find out if that really is a problem?
Too many regions?
With 12GB of heap and default hbase.regionserver.global.memstore.upperLimit of 0.4, we have 4.8GB of heap before writes are blocked and flushes are forced. We have 700 regions, 4.8GB for memstore: the cluster would make tiny flushes of ~ 7MB (instead of configured 128MB) or even less; if all regions were active. Even if all the regions are not active but upperLimit for combined memstore is reached, memory flushes would happen.
On this cluster, there were tiny flushes of 1-10 MB and at times large flushes of 50-128MB as well. All the 700 regions on this cluster were not active. Defining active here is little difficult. A region can be considered active if it attracts reads or writes or both. But since we are focusing on memory flushes, let's say a region is active if attracts writes.
Here is one region on one of the busy nodes:
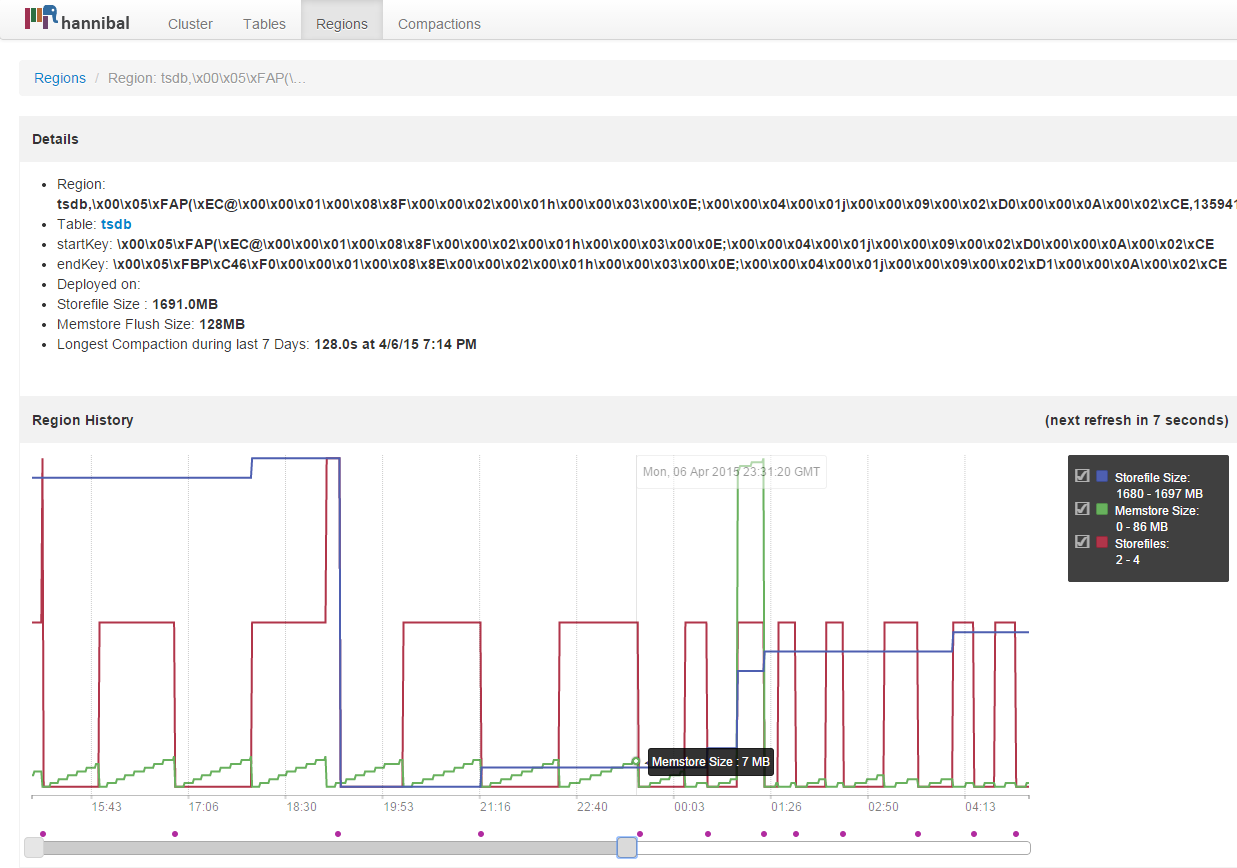
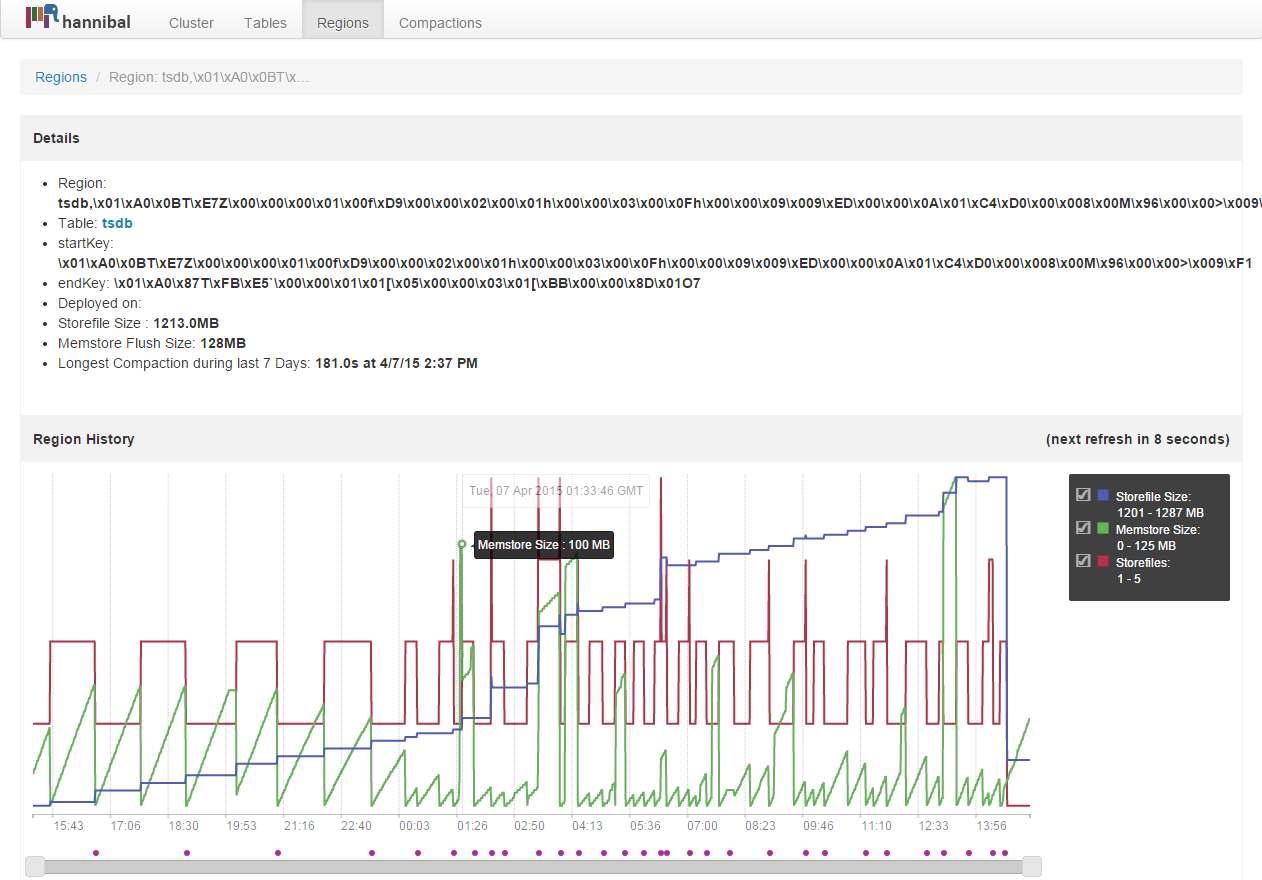
Notice the memory flush pattern, it is almost at 7MB. Here is another region with flushes. This one has larger flush size.
Tiny memory flushes would create many smaller files and those small files would keep on triggering minor compactions (ruled by several compaction and file related configuration parameters) all the time. Many smaller files can also cause writes to accumulate in memory as per hbase.hstore.blockingStoreFiles config which defaults to 10. Therefore, if we have 10 or more store files (small or large) updates are blocked for that region or until hbase.hstore.blockingWaitTime. After blockingWaitTime upates are allowed to a max of hbase.hregion.memstore.block.multiplier * hbase.hregion.memstore.flush.size which is 1024 MB with default settings.
As we can see, this is a vicious cycle.
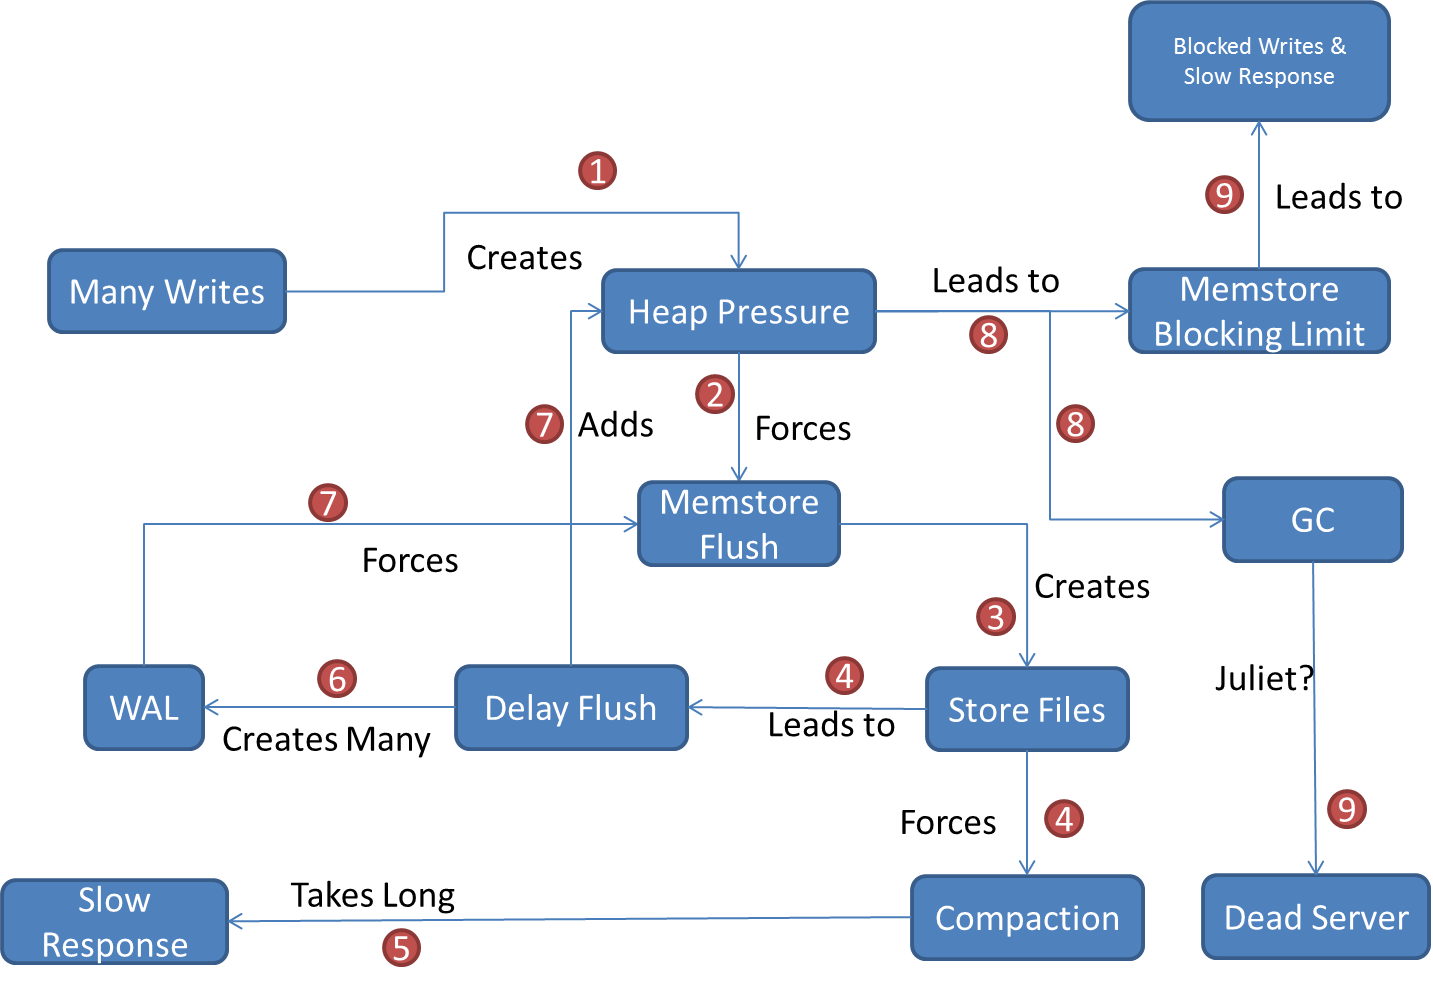
Memory pressure results in smaller files which results in more writes into memory which again results in more files! Many files on many regions would lead to a substantial compaction queue size. Compaction queue is the compactions tasks on regions that Hbase needs to perform. As to when a compaction is carried on a region is dependent on Hbase internals. One of the reasons that could force quick compaction is many writes and global memory pressure. One can check below line in region server logs:
16:24:55,686 DEBUG org.apache.hadoop.hbase.regionserver.MemStoreFlusher: Under global heap pressure: Region tsdb, ......
This is how the compaction queue size looks on the hot region server:
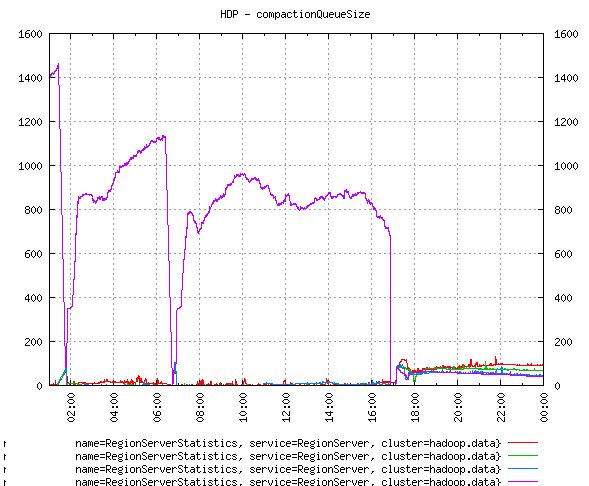
The box with most writes is having a huge compaction queue size. This clearly indicates that the box is under memory pressure.
(Curious minds would question the sudden drop thrice in the queue size, upon investigation i found out that the region server became too busy compacting and had a Juliet pause. It could not contact zookeeper in configured timeout and was declared dead! The region server shut itself down BUT there was a magic restart script running on the box that restarted it. We know how to fix a problem, don't we :-)
In the logs we can see below line:
09:41:00,615 WARN org.apache.hadoop.hbase.util.Sleeper: We slept 23274ms instead of 3000ms, this is likely due to a long garbage collecting pause and it's usually bad, see http://hbase.apache.org/book.html#trouble.rs.runtime.zkexpired
)
And this is why we need to avoid frequent memory flushes.
Other than writes, some heap would be used to serve reads as well. Many reads would touch several regions or regions not currently being written. Especially for openTSDB, a query for past 6 months may touch many regions.
Coming back to the cluster in question, we now know that one of the nodes seems to be holding majority of the active (or hot) regions. And that node comes under memory pressure due to high writes and reads resulting in poor response times for queries.
We now understand as to why we have slow response times, how do we solve this? Also, how do we distribute the load more evenly?
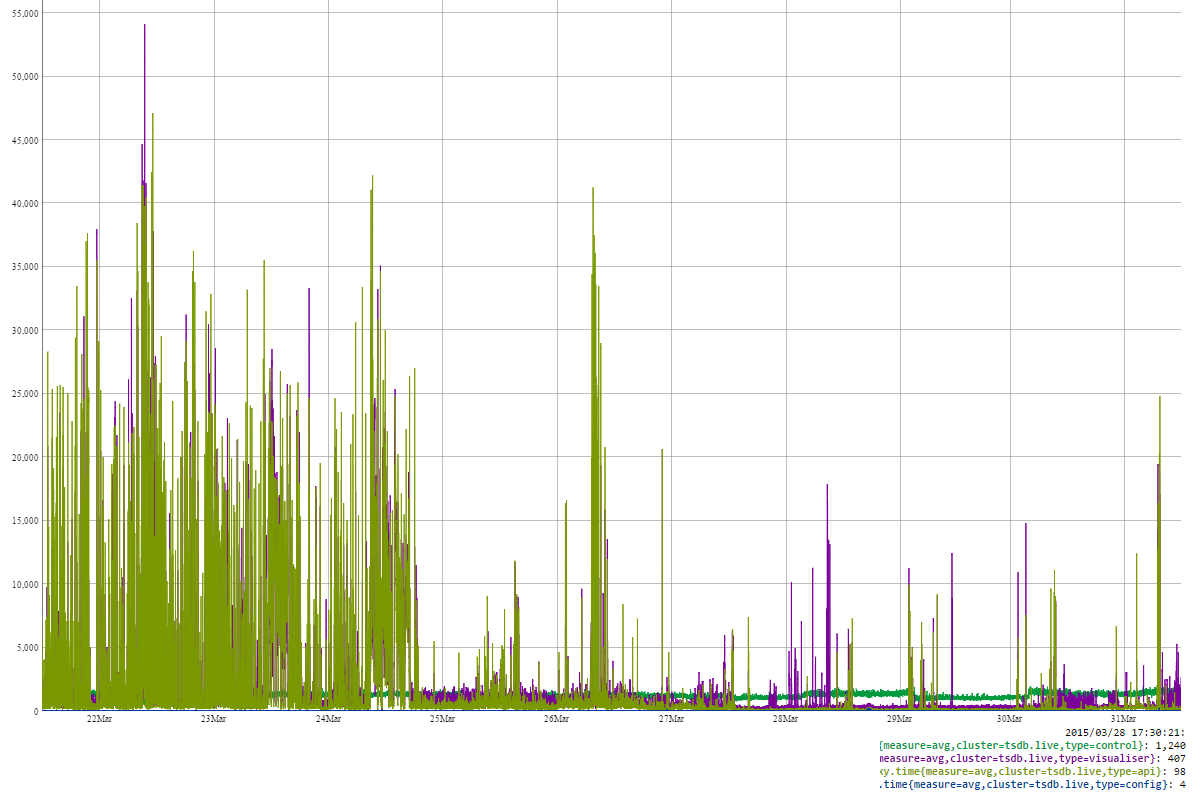
Serendipity in failure
While trying to understand the problem in full, I looked at data going back as far a month. And found this:
In the past, writes have been switching from one box to another. In the picture above, a drop in purple was actually a GC pause (had to look at region server logs and zookeeper logs) and region server was declared dead. By the time this region server was up and running again, all the hot regions were moved to another node. How did that happen? The Hbase balancer. The balancer detects a node failure and moves regions to other nodes in the cluster. Here, i guess, due to Hbase-57, regions are assigned to a box with a replica.
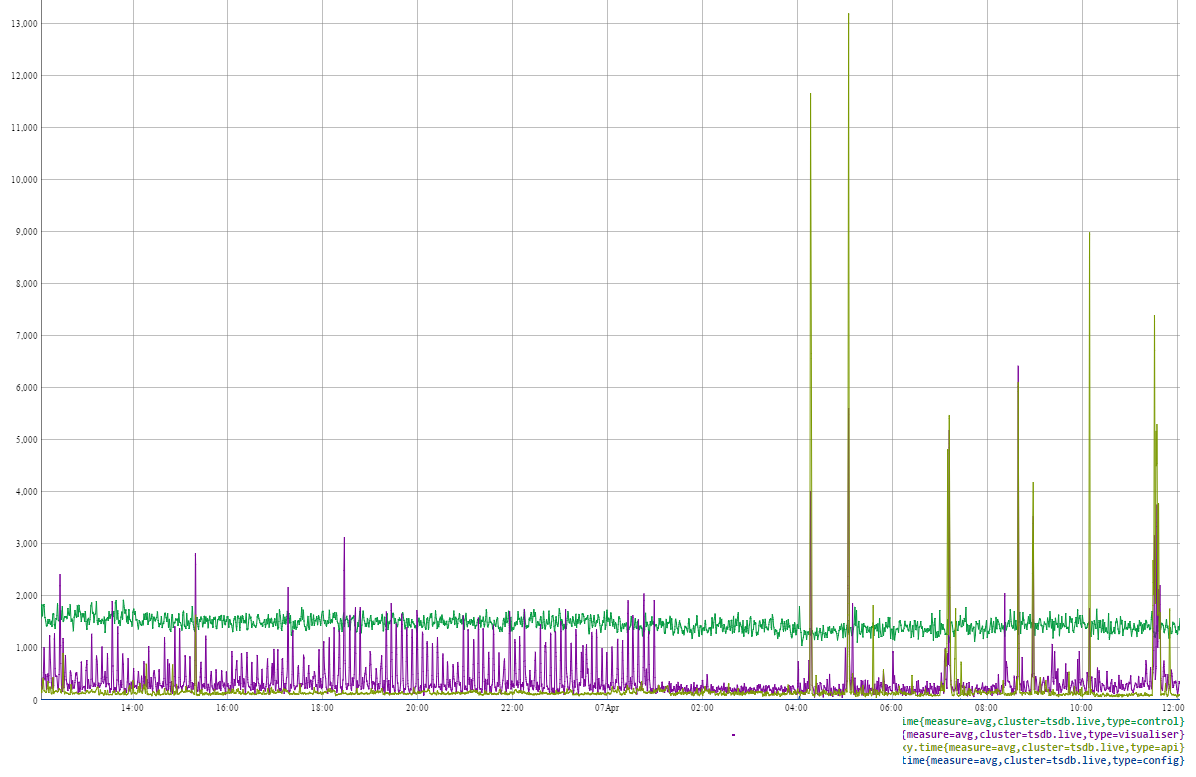
This crossover happened several times in the past. Here is another.
The surprise was how the balancer was moving regions after RS restarts. And this explains how we could have ended up in the current situation. Random RS going off causes it regions to fly to other RSs and it may have overloaded already overloaded node.
A balancing Act
Now that we understood as to why we are where we are and why response times are slow, we needed to fix it. Couple of options:
1. add more nodes in the cluster and hope heavy writes go to new node
2. Manually move regions to lightly loaded nodes
Before adding new hardware, i wanted to check if the current one was sufficient. So went with option 2.
We needed to move some of the writes and reads to other 3 nodes of the cluster. One node was doing too much while others were sitting idle. One solution was to move some hot regions to other nodes manually. How do we find hot regions?
On the region server status web page i.e. http://:60030/rs-status, we get a list of all the regions this server holds with other stats per region like numberOfStoreFiles, numberOfReads, numberOfWrites etc.
These stats are reset on server restart. So, they do not represent data from the time a region came into being. Still, these stats give us valuable information. I grabbed the table that lists all the regions and paste it into an excel sheet. Sort on two key metric: read and write count. Resultant ordering may not be the very accurate view of hot/active regions but it gives us lots to play with. We cannot move a region manually at hbase shell:
move '9ba6c6158e2b3026b22d623db74cb488','region-server-domain-address,60020,region-server-start-key'
Where region-server-domain-address is the node where we want to move given region to. One can get the start-key from master status page.
I tried moving one of the regions manually to a less loaded node and it worked. Only to find out some time later (5 mins) that it had moved back! WTF?! Turned out it was the Hbase Balancer at work. In its obsession with region counts, it deduced that the just moved region has skewed the region balance and hence moved it back.
What's the solution then? We turn the balancer off. And that seems logical as well given our reads and writes are skewed. Our load is not equally distributed across regions therefore keeping same regions counts on all nodes is not the best strategy.
After turning the load balancer off at the hbase shell
balance_switch true
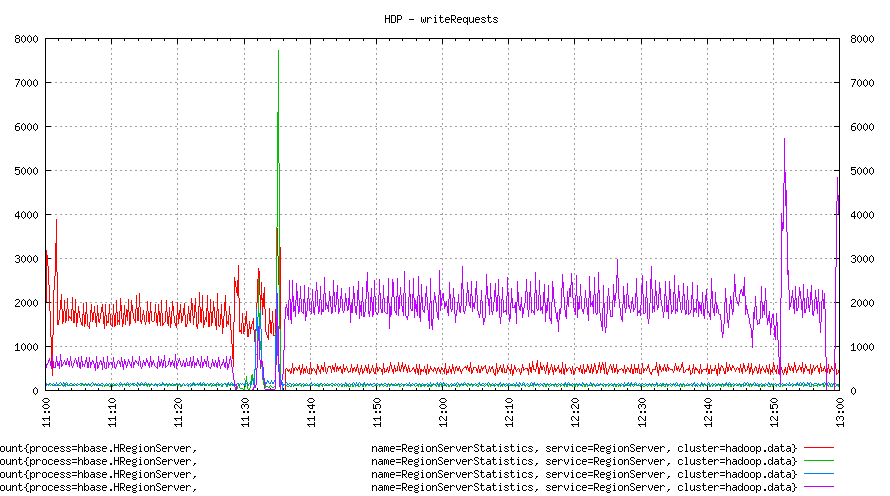
I moved top 25-30 regions from the busiest node to other nodes randomly. This move was a mix of high writes and high reads.
We can see that the writes and reads move to other nodes. We can now see all colours in the graph. There was a change in response times as well.
There was a gradual reduction in response time while regions were being moved. The next day though, the response times were much more acceptable. Heap usage, Total GC times on the loaded node improved too.
But as things looked to stabilise, one of the machines had a stop-the-world GC pause and all its regions started moving to other 3 nodes. In the absence of balancer, they could have gone anywhere and may have ended up one node filling up all its disks. So i had to turn the balancer on! And we were back at where we started.
This led to a adding at least one new node to the cluster.
The balancer moved data from all other nodes to this new node keeping the overall region count same on all nodes. Writes were still skewed.
We switched off the balancer now and moved regions manually again. And here is how things looked. We move regions with heavy writes to two least utilised nodes. We can see a drop in writes for one of the loaded nodes below.
Several further moves resulted in evenly balanced writes on all nodes.
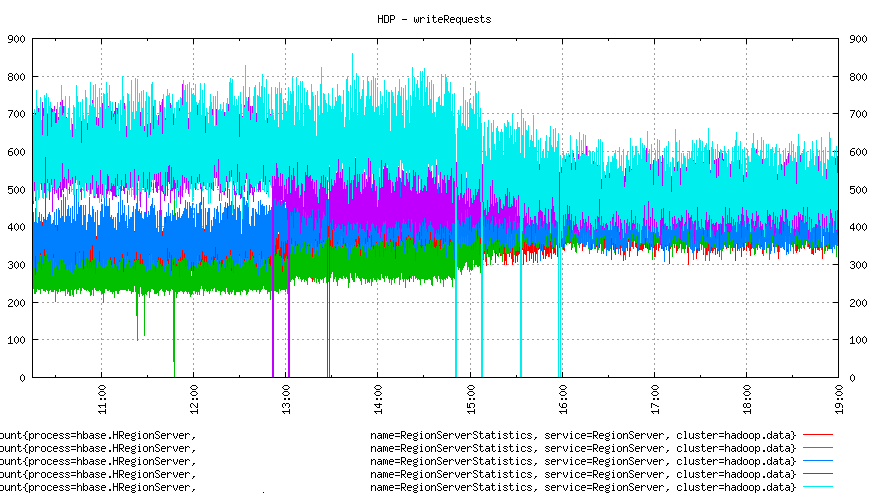
A full day looked like this:
And this is how response times changed. This is a view of 10 day period when times were worst and moved to better.
Looking more closely,
As we can see, manually moving active/hot regions to under-utilised nodes have worked for us. We have a balanced cluster and improved response times.
We love tsdb, again!
Everyone is happy and people love tsdb again. There were several other things that happened in terms of disks, Hadoop etc. I will write that in a separate post.
Bottom line, Hadoop eco-system tools and frameworks are designed to work under extreme conditions but there is a limit up to which we can stretch them. A tool cannot keep on working for a eternity on initial capacity. Extra capacity and tweaks are needed as the system grows over time.
Also, it is great to invest in higher level abstractions, understanding a level underneath is crucial for the abstraction to continue to work for us.